Good day. Welcome to the fortnightly DR Wakefield Market Report for the period covering Monday 12th July to Friday 23rd July.
This week’s report is a special edition on the recent frost in Brazil. Last week, the market opened at 160.50 c/lb and rose to a high of 209.50 c/lb on Friday, before closing the week out at 189 c/lb, 17.8% (28.5 c/lb) higher than how it started.

Let’s unpack what happened.
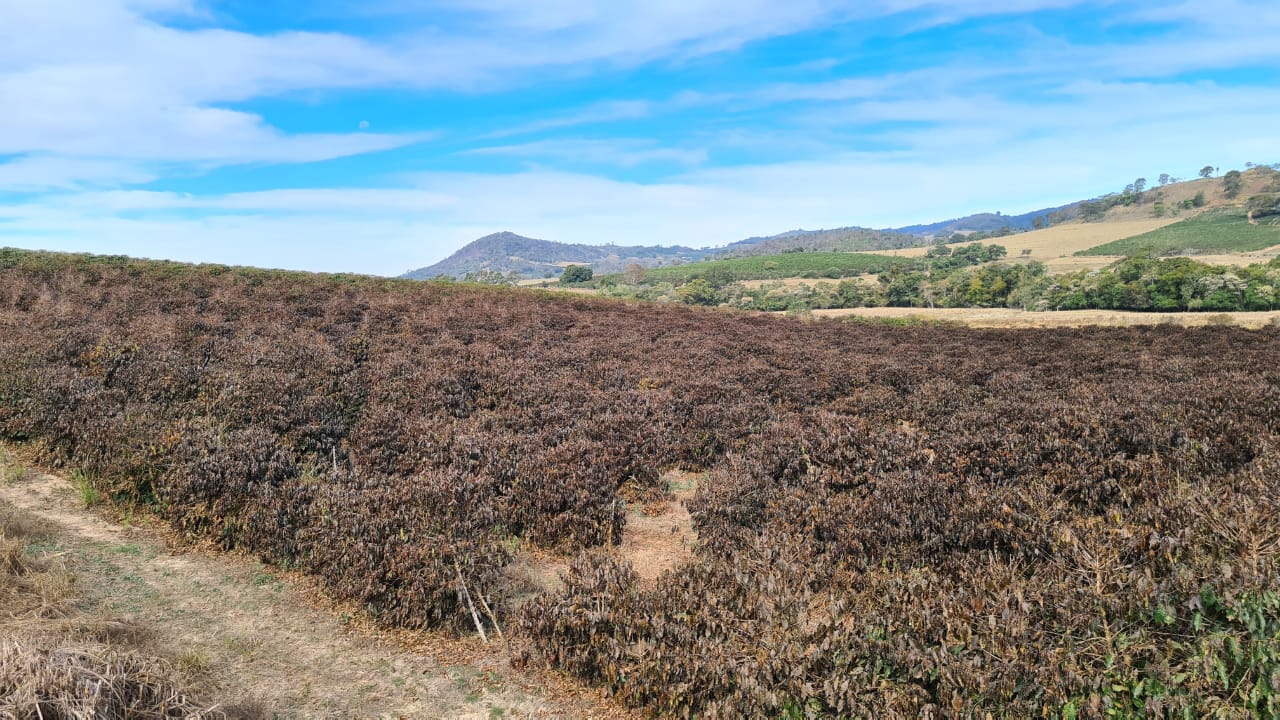
Brazil below zero? Nearly 10% of Brazilian Arabica producers woke up on Tuesday morning to see sub-zero temperatures and frost on their plants. Although it was predicted a cold front would occur, the severity of the frost was much worse than forecasted. To put this into context, it was only a couple of months ago that we reported on how the Brazilian government had issued a water emergency alert for severe droughts in five Brazilian states, the first time in 111 years that a warning of this type had been issued: it’s certainly been an atypical weather year for Brazil. But why the spike in prices? The daily moves look more like cryptocurrency than coffee!
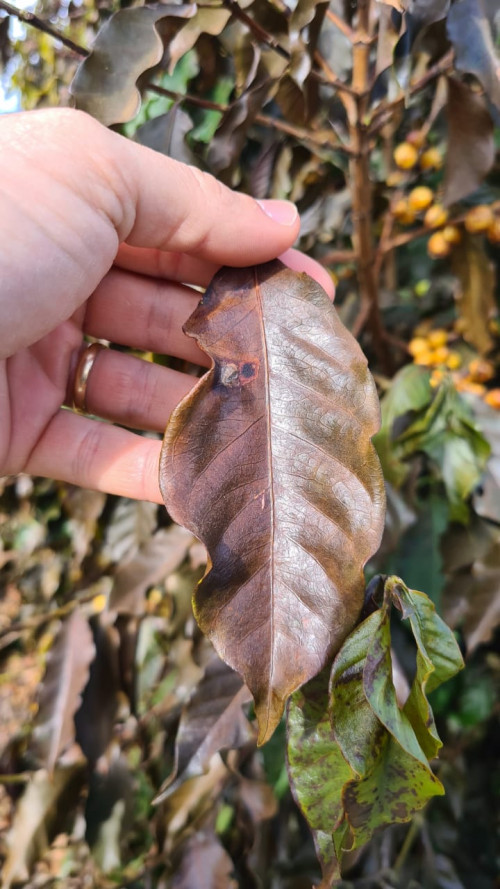
The main cause is the frost’s impact on next year’s Brazilian harvest (2022/2023). Brazil is the biggest producer of Arabica in the world so of course, anything that will reduce or increase its harvest will have a sizeable effect on global supply. We know the impact of the frost will reduce Brazil’s 2022/23 harvest and the industry is attempting to price in that expected supply shortage. I say attempting as, like with any forecast, there is always variation between market participants.
It is not uncommon for there to be differences of millions of bags when organisations put out their Brazilian crop predictions. The same goes for when they predict the impact of frost. We have seen some people state that the damage is no more than 2 million bags, while others think we could be seeing a toll closer to the figure of 6 million bags. The question is, how bad is the damage?
While uncertainty around that question remains, the market will be volatile. There will likely be 2 clear stages of this uncertainty. The first stage will be when the industry is trying to work out the immediate frost damage and make a prediction based on that. This is where we are now. The second stage will be when the coffee trees enter the flowering stage, usually in September. Data from the flowering stage will give us a much more accurate forecast, and therefore reduce the uncertainty. When that happens, we may see another big move.
There is also more interest in coffee. With increasing evidence coming out that inflation could be more than just a short-term danger, many funds are again investing into commodities as a hedge. With more speculators with skin in the game, this may increase the bullish sentiment we are experiencing. Coffee has become popular in index fund portfolios and it would not surprise me if we see the net index long position continue to hit record highs.
When did we last see pricing like this?
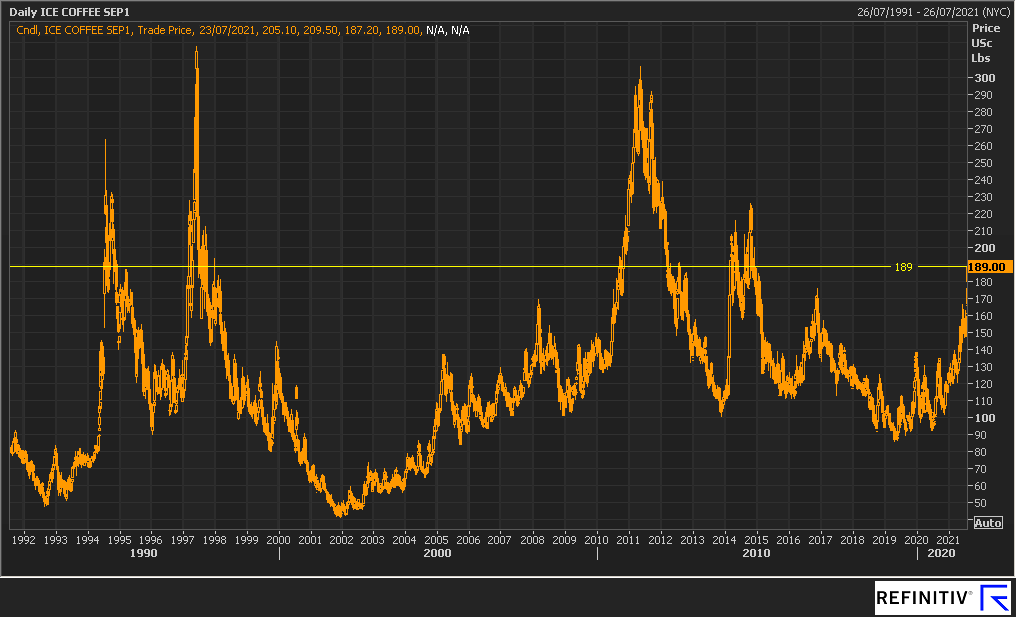
The graph above represents the movements of the coffee market in the last 30 years. 189 c/lb was the close on Friday but its high was 209.50 c/lb. When did it last hit that level? 17th October 2014. There have only been 4 previous instances in the last 30 years where we have traded above the 2$ mark so it is noteworthy that we eclipsed that mark last week. If we do again trade about 2$, how long could we be there for? Looking at the last 4 times this happened, none of the occurrences happened for much longer than a year. What will dictate the duration of our stay is the extent of the crop damage and if any other cold fronts occur.
The coffee market opened 2021 on the 4th January at 128.40 c/lb, 60.6 c/lb less than Friday’s close at 189 c/lb representing a 47% increase. The question is, how much will be see this figure rise by? Will we see Jack Frost return? Only he knows that for sure, but what we do know is that there is another cold front expected this week. Strap in, as we may see this bull run continue to surge.


